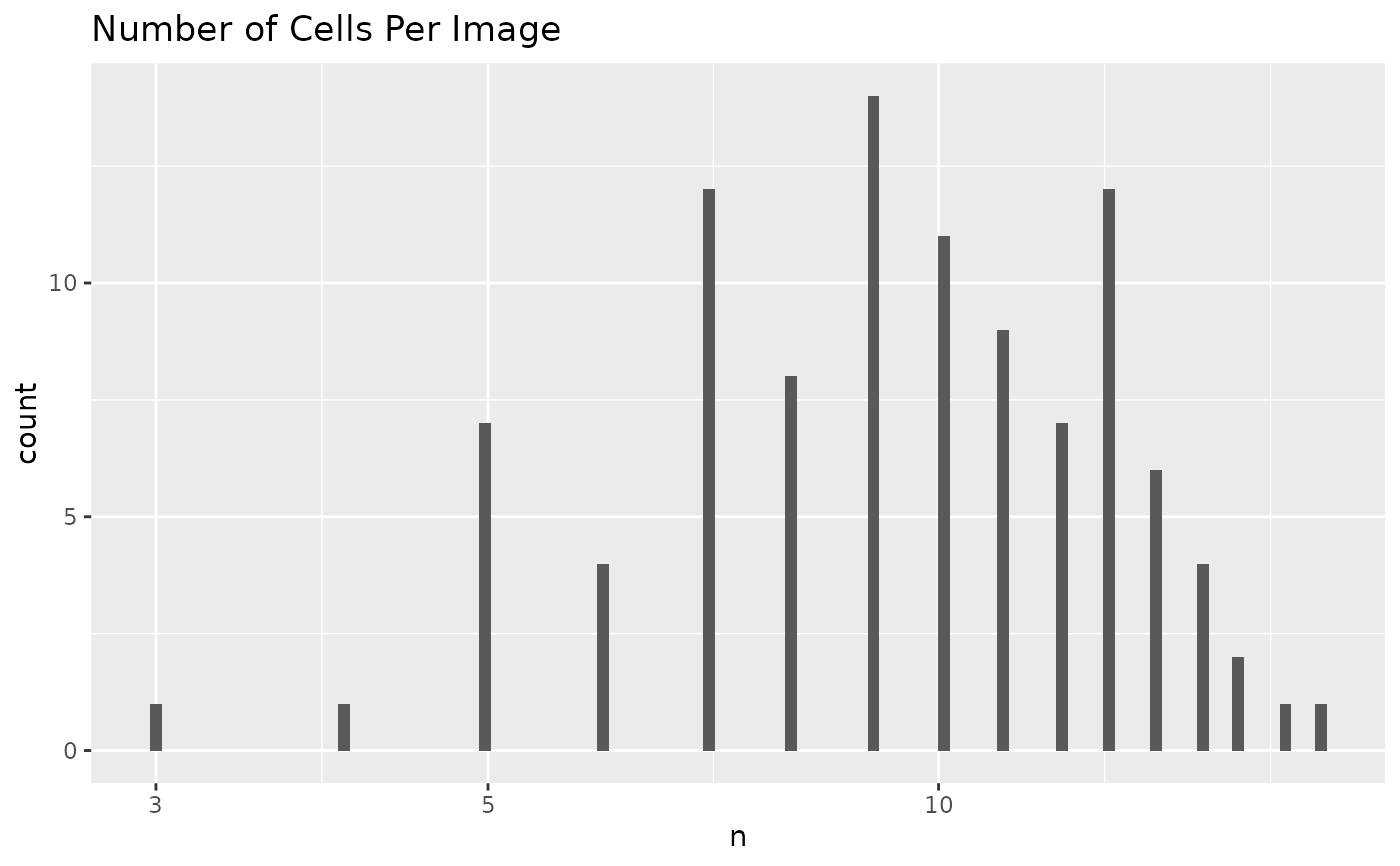
Plot number of cells per image
Arguments
- sce
SingleCellExperimentobject- bins
Number of histogram bins
Value
ggplot2 object
Examples
set.seed(23)
cell_file <- generate_data()
sce <- loadData(cell_file)
plotCellsPerImage(sce)
Plot number of cells per image
SingleCellExperiment object
Number of histogram bins
ggplot2 object
set.seed(23)
cell_file <- generate_data()
sce <- loadData(cell_file)
plotCellsPerImage(sce)