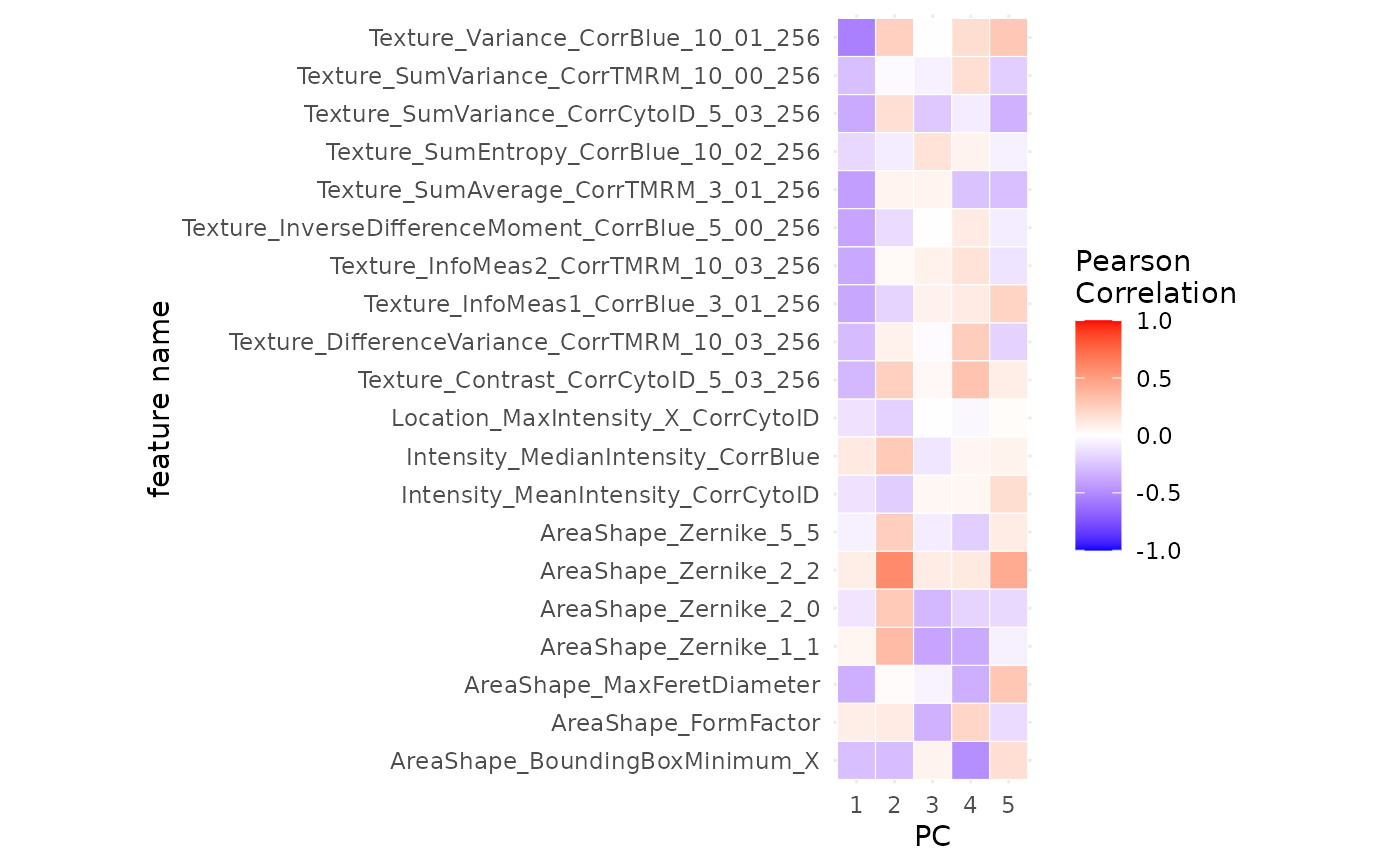
Plot number of cells per image
Usage
plotPCACor(
  sce,
  filter_by = 1,
  top = 20,
  pcs = seq(5),
  assay_type = "tfmfeatures"
)
Arguments
- sce
SingleCellExperimentobject- filter_by
PC to use for feature selection
- top
Number of top features to select
- pcs
Number of PCs to plot
- assay_type
A string specifying the assay
Value
ggplot2 object
Examples
set.seed(23)
cell_file <- generate_data()
sce <- loadData(cell_file)
sce <- transformScale(sce, robust = TRUE)
sce <- scater::runPCA(sce, exprs_values = "tfmfeatures", ncomponents = 10)
plotPCACor(sce, filter_by = 1)