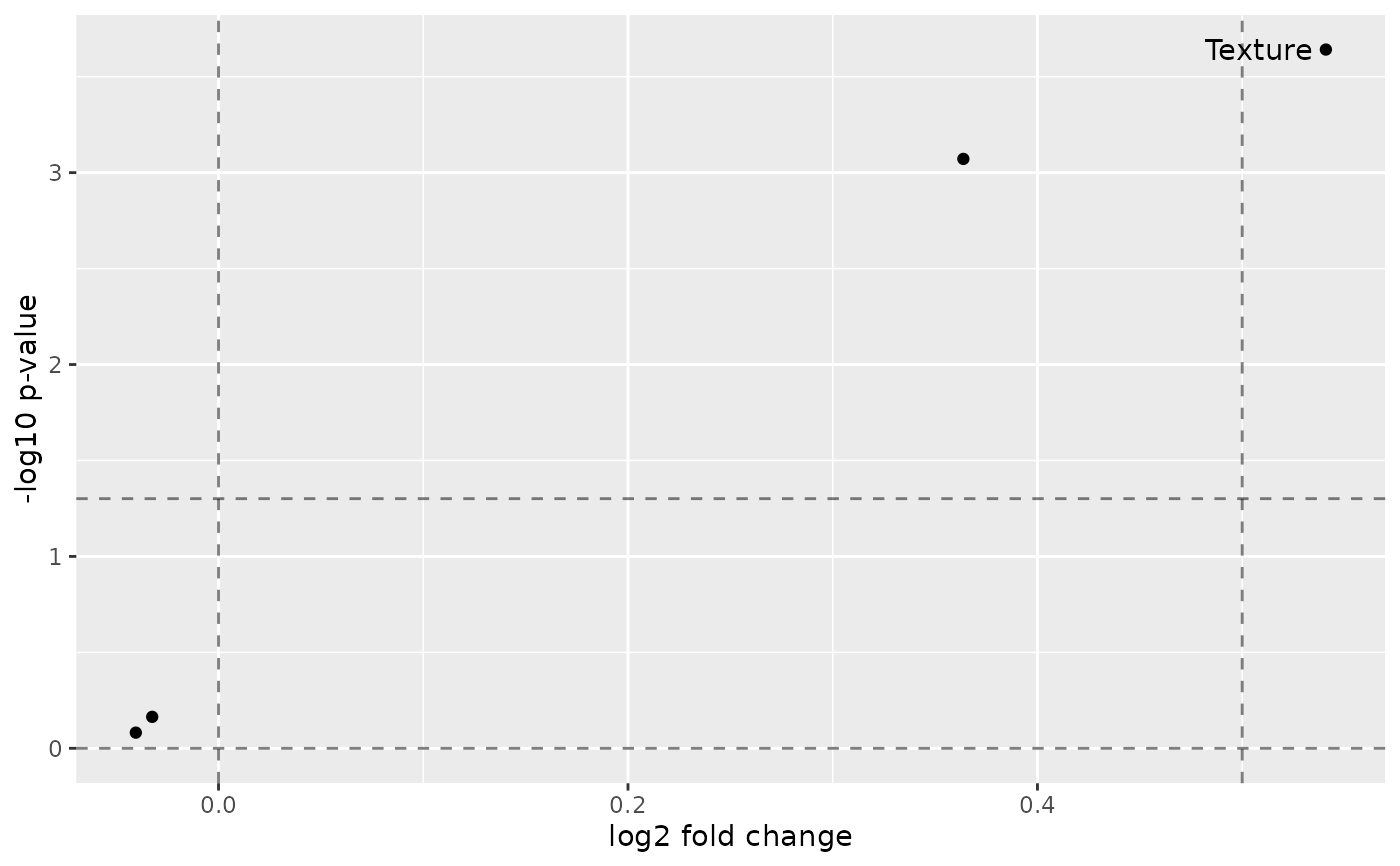
Plot predicted leave-one-out probabilities
Arguments
- sce
A
SingleCellExperimentobject- target
Name of target variable for prediction
- group
Grouping variable for cross-validation, e.g., patient
- p_cutoff
Cut-off for statistical significance. A horizontal line will be drawn at -log10(p_cutoff).
- fc_cutoff
Cut-off for absolute log2 fold-change. A vertical lines will be drawn at fc_cutoff.
- assay_type
A string specifying the assay
Value
ggplot2 object
Examples
set.seed(23)
cell_file <- generate_data()
sce <- loadData(cell_file)
sce <- transformScale(sce)

sce$Drug <- as.factor(sce$Drug)
sce$Drug <- relevel(sce$Drug, ref = "D1")
types <- c("AreaShape", "Intensity", "Texture")

sce_single <- predictLOO(
    sce,
    target = "Drug", group = "Patient",
    interest_level = "D7", reference_level = "D1",
    types = types,
    n_threads = 1
)

volcanoPlot(sce_single,
    target = "Drug", group = "Patient",
    p_cutoff = 0.05, fc_cutoff = 0.5
)