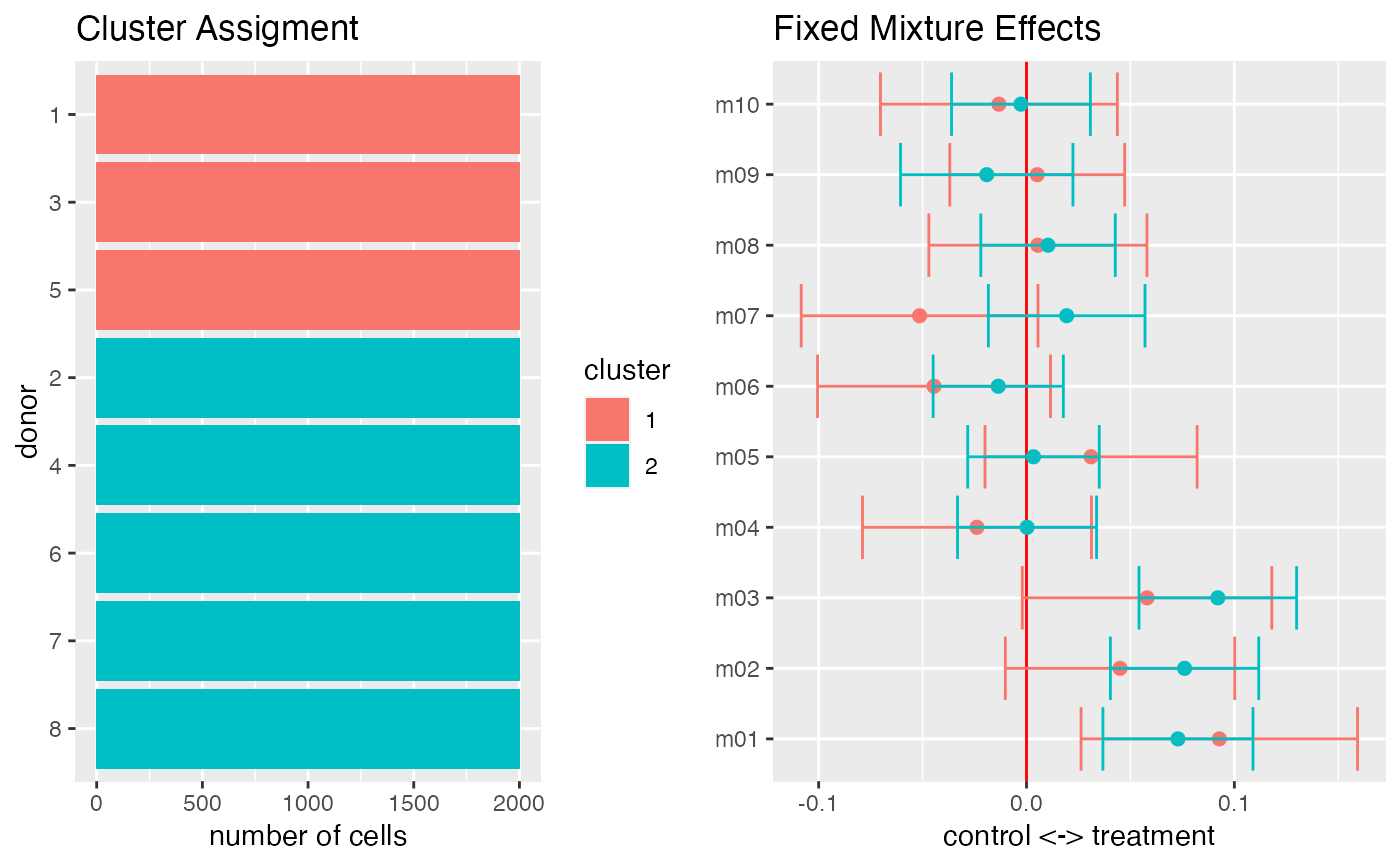
Plot all components of mixture regression
# S3 method for cytoflexmix
plot(x, k = NULL, separate = FALSE, ...)
Arguments
| x | A |
|---|---|
| k | Number of clusters |
| separate | create two separate |
| ... | Other parameters |
Value
ggplot2 object
Examples
set.seed(23)
df <- generate_data()
protein_names <- names(df)[3:12]
df <- dplyr::mutate_at(df, protein_names, function(x) asinh(x/5))
mix_fit <- CytoGLMM::cytoflexmix(df,
                                 protein_names = protein_names,
                                 condition = "condition",
                                 group = "donor",
                                 ks = 2)
#> 2 : * * * * *
plot(mix_fit)