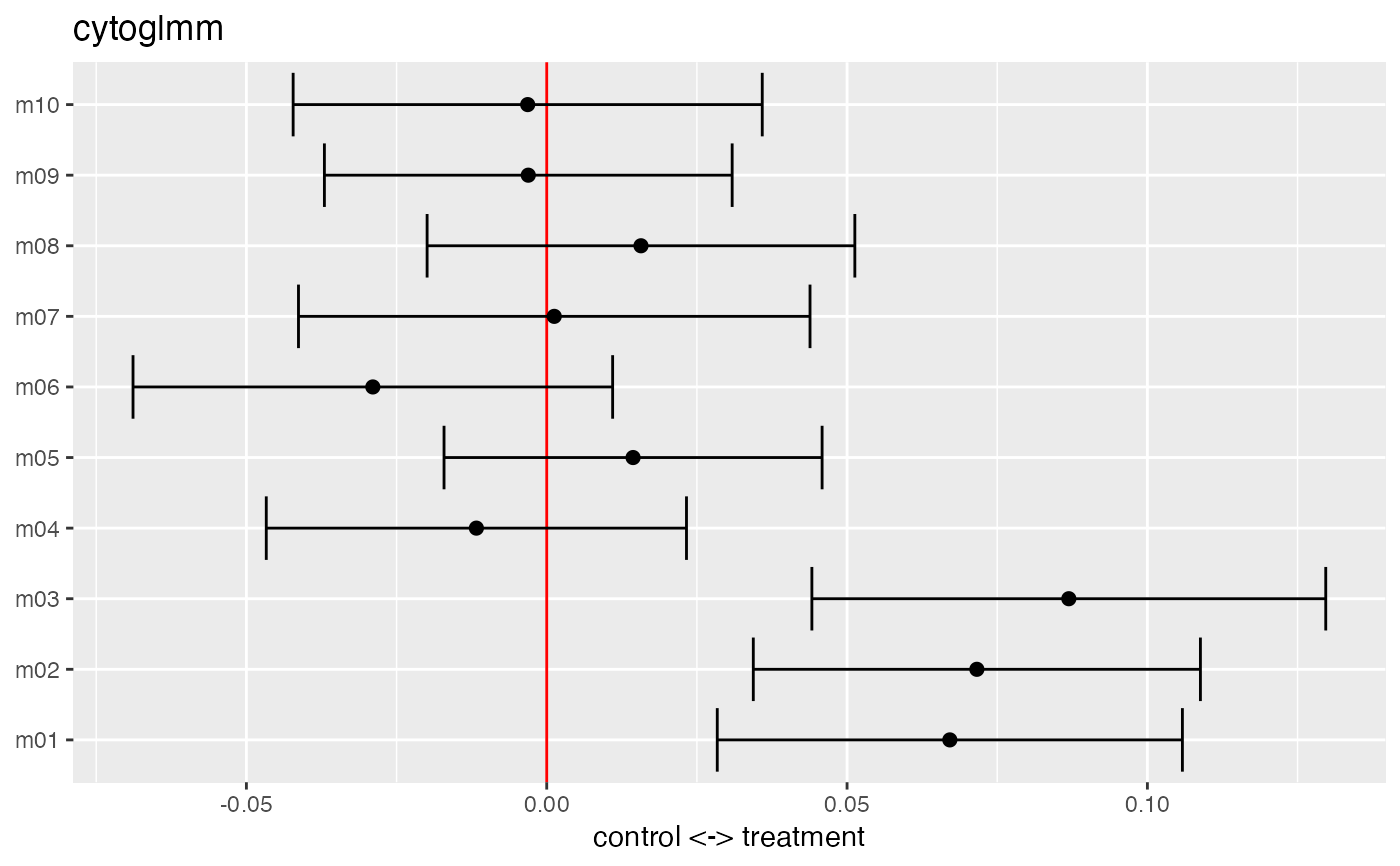
Plot fixded coefficients of random effects model
# S3 method for cytoglmm
plot(x, order = FALSE, separate = FALSE, ...)
Arguments
| x | A |
|---|---|
| order | Order the markers according to the mangintute of the coefficients |
| separate | create two separate |
| ... | Other parameters |
Value
ggplot2 object
Examples
set.seed(23)
df <- generate_data()
protein_names <- names(df)[3:12]
df <- dplyr::mutate_at(df, protein_names, function(x) asinh(x/5))
glmm_fit <- CytoGLMM::cytoglmm(df,
                               protein_names = protein_names,
                               condition = "condition",
                               group = "donor")
#> Warning: moment-based covariance matrix estimate is not positive semi-definite; using projection
plot(glmm_fit)