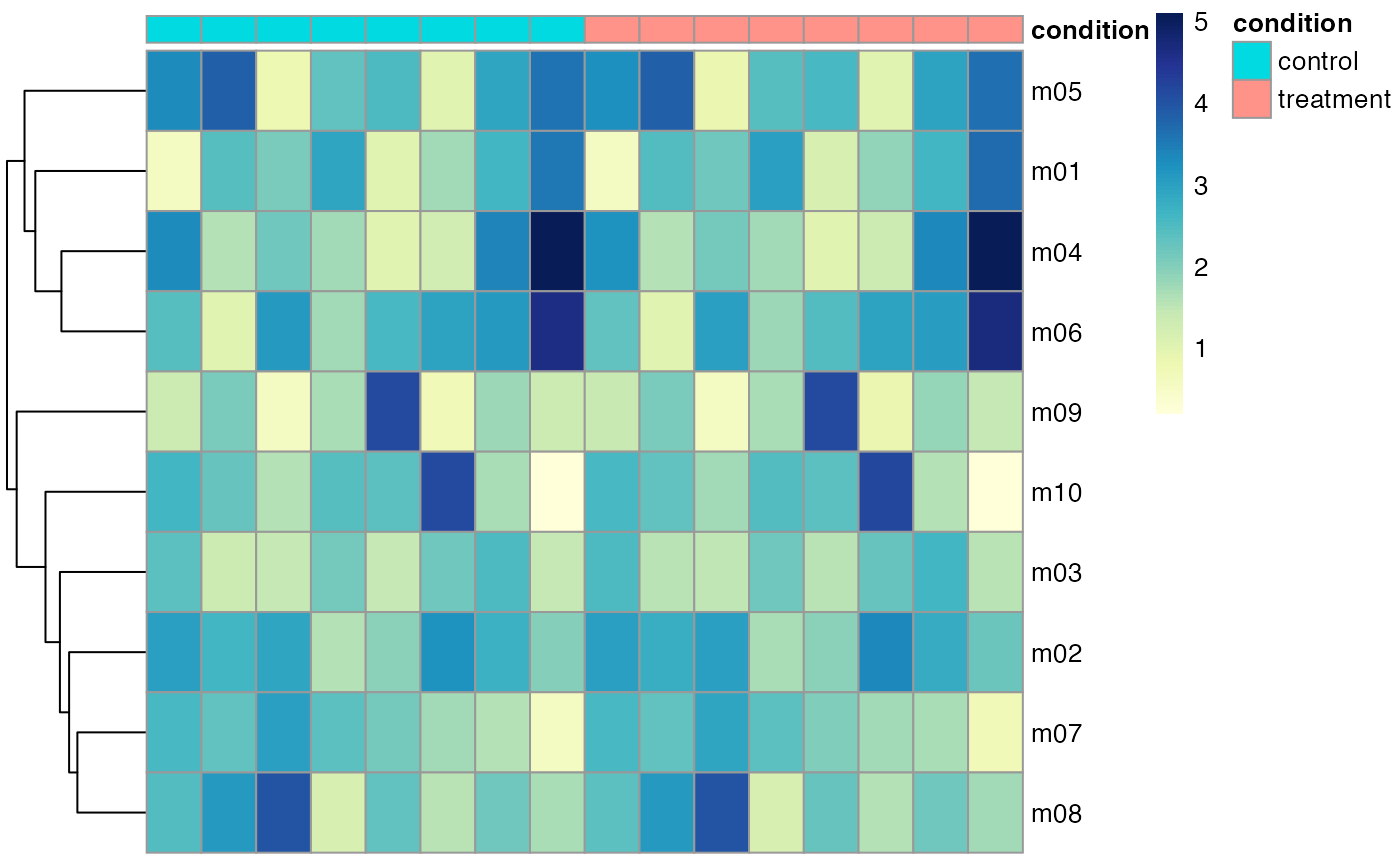
Heatmap of median marker expression
plot_heatmap(
  df_samples,
  sample_info_names,
  protein_names,
  arrange_by_1,
  arrange_by_2 = "",
  cluster_cols = FALSE,
  fun = median
)
Arguments
| df_samples | Data frame or tibble with proteins counts, cell condition, and group information |
|---|---|
| sample_info_names | Column names that contain information about the cell, e.g. donor, condition, file name, or cell type |
| protein_names | A vector of column names of protein to use in the analysis |
| arrange_by_1 | Column name |
| arrange_by_2 | Column name |
| cluster_cols | Apply hierarchical cluster to columns |
| fun | Summary statistics of marker expression |
Value
pheatmap object
Examples
set.seed(23)
df <- generate_data()
protein_names <- names(df)[3:12]
df <- dplyr::mutate_at(df, protein_names, function(x) asinh(x/5))
CytoGLMM::plot_heatmap(df,
                       protein_names = protein_names,
                       sample_info_names = c("donor", "condition"),
                       arrange_by_1 = "condition")
#> Warning: The `.dots` argument of `group_by()` is deprecated as of dplyr 1.0.0.
#> This warning is displayed once every 8 hours.
#> Call `lifecycle::last_lifecycle_warnings()` to see where this warning was generated.