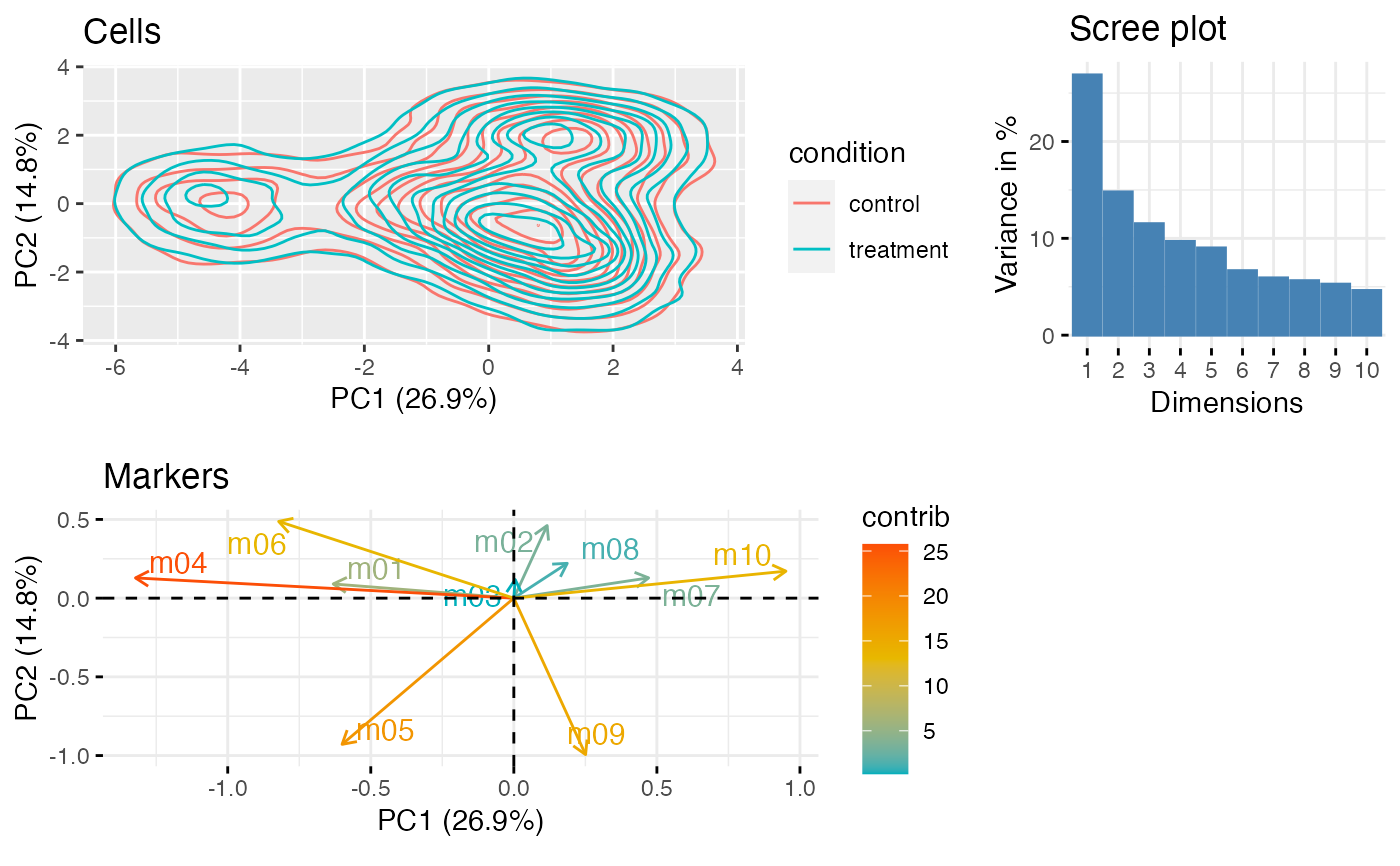
Plot PCA of subsampled data using ggplot
plot_prcomp(
  df_samples,
  protein_names,
  color_var = "treatment",
  subsample_size = 10000,
  repel = TRUE
)
Arguments
| df_samples | Data frame or tibble with proteins counts, cell condition, and group information |
|---|---|
| protein_names | A vector of column names of protein to use in the analysis |
| color_var | A column name |
| subsample_size | Subsample per color_var variable |
| repel | Repel labels |
Value
cowplot object
Examples
set.seed(23)
df <- generate_data()
protein_names <- names(df)[3:12]
df <- dplyr::mutate_at(df, protein_names, function(x) asinh(x/5))
CytoGLMM::plot_prcomp(df,
                      protein_names = protein_names,
                      color_var = "condition")
#> Warning: `group_by_()` was deprecated in dplyr 0.7.0.
#> Please use `group_by()` instead.
#> See vignette('programming') for more help
#> This warning is displayed once every 8 hours.
#> Call `lifecycle::last_lifecycle_warnings()` to see where this warning was generated.