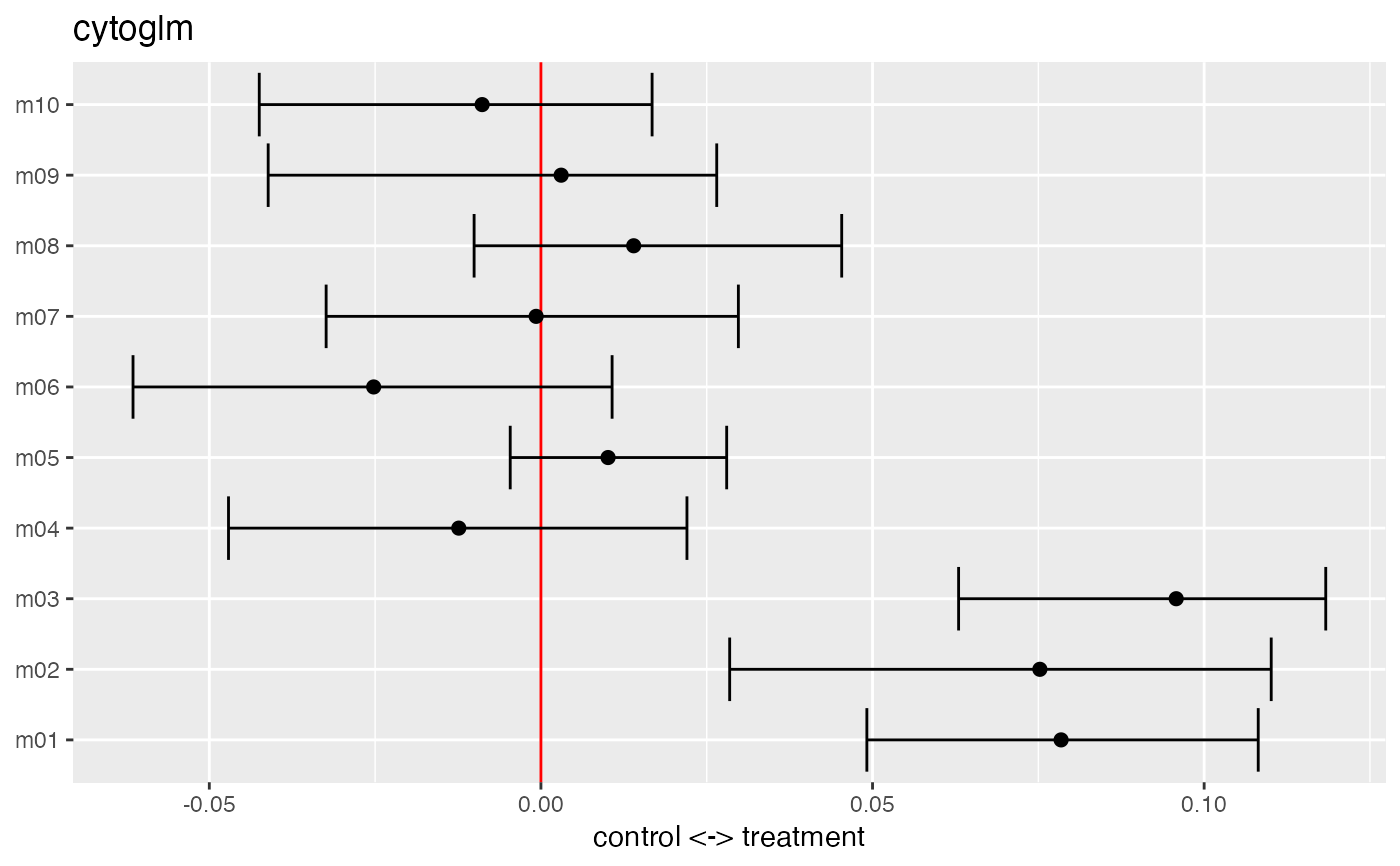
Plot bootstraped coefficients
# S3 method for cytoglm
plot(x, order = FALSE, separate = FALSE, ...)
Arguments
| x | A |
|---|---|
| order | Order the markers according to the mangintute of the coefficients |
| separate | create two separate |
| ... | Other parameters |
Value
ggplot2 object
Examples
set.seed(23)
df <- generate_data()
protein_names <- names(df)[3:12]
df <- dplyr::mutate_at(df, protein_names, function(x) asinh(x/5))
glm_fit <- CytoGLMM::cytoglm(df,
                             protein_names = protein_names,
                             condition = "condition",
                             group = "donor",
                             num_boot = 10) # in practice >=1000
plot(glm_fit)