Plot posterior summaries for Poisson log-normal mixed model
Source:R/plot.cytoeffect_poisson.R
plot.cytoeffect_poisson.RdPlot posterior summaries for Poisson log-normal mixed model
# S3 method for cytoeffect_poisson
plot(x, type = "beta", selection = x$protein_names, ...)
Arguments
- x
Object of class
cytoeffect_poissoncomputed usingpoisson_lognormal- type
A string with the parameter to plot:
type = "theta",type = "beta",type = "sigma", ortype = "Cor"- selection
A vector of strings with a selection of protein names to plot
- ...
Other parameters
Value
ggplot2 object
Examples
set.seed(1)
df = simulate_data(n_cells = 10)
str(df)
#> tibble [80 × 7] (S3: tbl_df/tbl/data.frame)
#>  $ donor    : chr [1:80] "pid01" "pid01" "pid01" "pid01" ...
#>  $ condition: Factor w/ 2 levels "control","treatment": 2 2 2 2 2 2 2 2 2 2 ...
#>  $ m01      : num [1:80] 80 6 6 3 17 20 14 90 79 46 ...
#>  $ m02      : num [1:80] 21 3 4 1 1 9 40 17 24 0 ...
#>  $ m03      : num [1:80] 6 2 12 49 3 8 14 6 0 4 ...
#>  $ m04      : num [1:80] 4 0 11 10 0 2 22 8 14 13 ...
#>  $ m05      : num [1:80] 12 0 3 0 0 1 1 4 1 1 ...
fit = poisson_lognormal(df,
                        protein_names = names(df)[3:ncol(df)],
                        condition = "condition",
                        group = "donor",
                        r_donor = 2,
                        warmup = 200, iter = 325, adapt_delta = 0.95,
                        num_chains = 1)
#> Warning: `group_by_()` was deprecated in dplyr 0.7.0.
#> ℹ Please use `group_by()` instead.
#> ℹ See vignette('programming') for more help
#> ℹ The deprecated feature was likely used in the dplyr package.
#>   Please report the issue at <https://github.com/tidyverse/dplyr/issues>.
#>
#> SAMPLING FOR MODEL 'poisson' NOW (CHAIN 1).
#> Chain 1:
#> Chain 1: Gradient evaluation took 0.00016 seconds
#> Chain 1: 1000 transitions using 10 leapfrog steps per transition would take 1.6 seconds.
#> Chain 1: Adjust your expectations accordingly!
#> Chain 1:
#> Chain 1:
#> Chain 1: Iteration:   1 / 325 [  0%]  (Warmup)
#> Chain 1: Iteration:  32 / 325 [  9%]  (Warmup)
#> Chain 1: Iteration:  64 / 325 [ 19%]  (Warmup)
#> Chain 1: Iteration:  96 / 325 [ 29%]  (Warmup)
#> Chain 1: Iteration: 128 / 325 [ 39%]  (Warmup)
#> Chain 1: Iteration: 160 / 325 [ 49%]  (Warmup)
#> Chain 1: Iteration: 192 / 325 [ 59%]  (Warmup)
#> Chain 1: Iteration: 201 / 325 [ 61%]  (Sampling)
#> Chain 1: Iteration: 232 / 325 [ 71%]  (Sampling)
#> Chain 1: Iteration: 264 / 325 [ 81%]  (Sampling)
#> Chain 1: Iteration: 296 / 325 [ 91%]  (Sampling)
#> Chain 1: Iteration: 325 / 325 [100%]  (Sampling)
#> Chain 1:
#> Chain 1:  Elapsed Time: 7.37117 seconds (Warm-up)
#> Chain 1:                3.68113 seconds (Sampling)
#> Chain 1:                11.0523 seconds (Total)
#> Chain 1:
#> Warning: The largest R-hat is NA, indicating chains have not mixed.
#> Running the chains for more iterations may help. See
#> https://mc-stan.org/misc/warnings.html#r-hat
#> Warning: Bulk Effective Samples Size (ESS) is too low, indicating posterior means and medians may be unreliable.
#> Running the chains for more iterations may help. See
#> https://mc-stan.org/misc/warnings.html#bulk-ess
#> Warning: Tail Effective Samples Size (ESS) is too low, indicating posterior variances and tail quantiles may be unreliable.
#> Running the chains for more iterations may help. See
#> https://mc-stan.org/misc/warnings.html#tail-ess
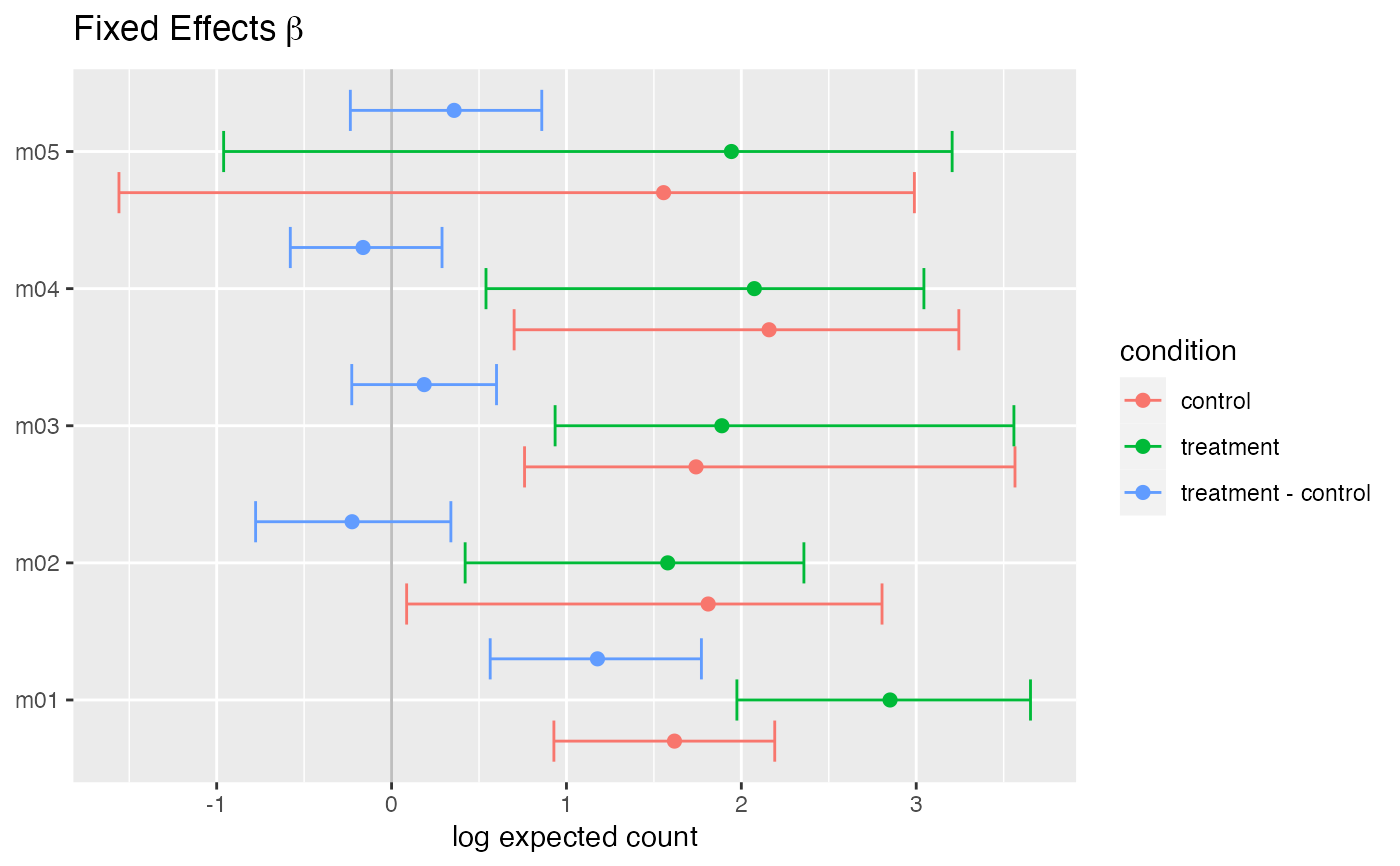
plot(fit, type = "beta")
